Every form collects data, but reading through responses one by one doesn’t scale. Smart Insights uses AI to automatically analyze your survey results so you can spot patterns, understand open-ended answers, and find correlations between questions in seconds.
Smart Insights is not a replacement for fine-grained statistical analysis tools like Excel or R. It’s designed to give you a fast, digestible overview of what your respondents are saying, grounded in real examples.
Where to find your results
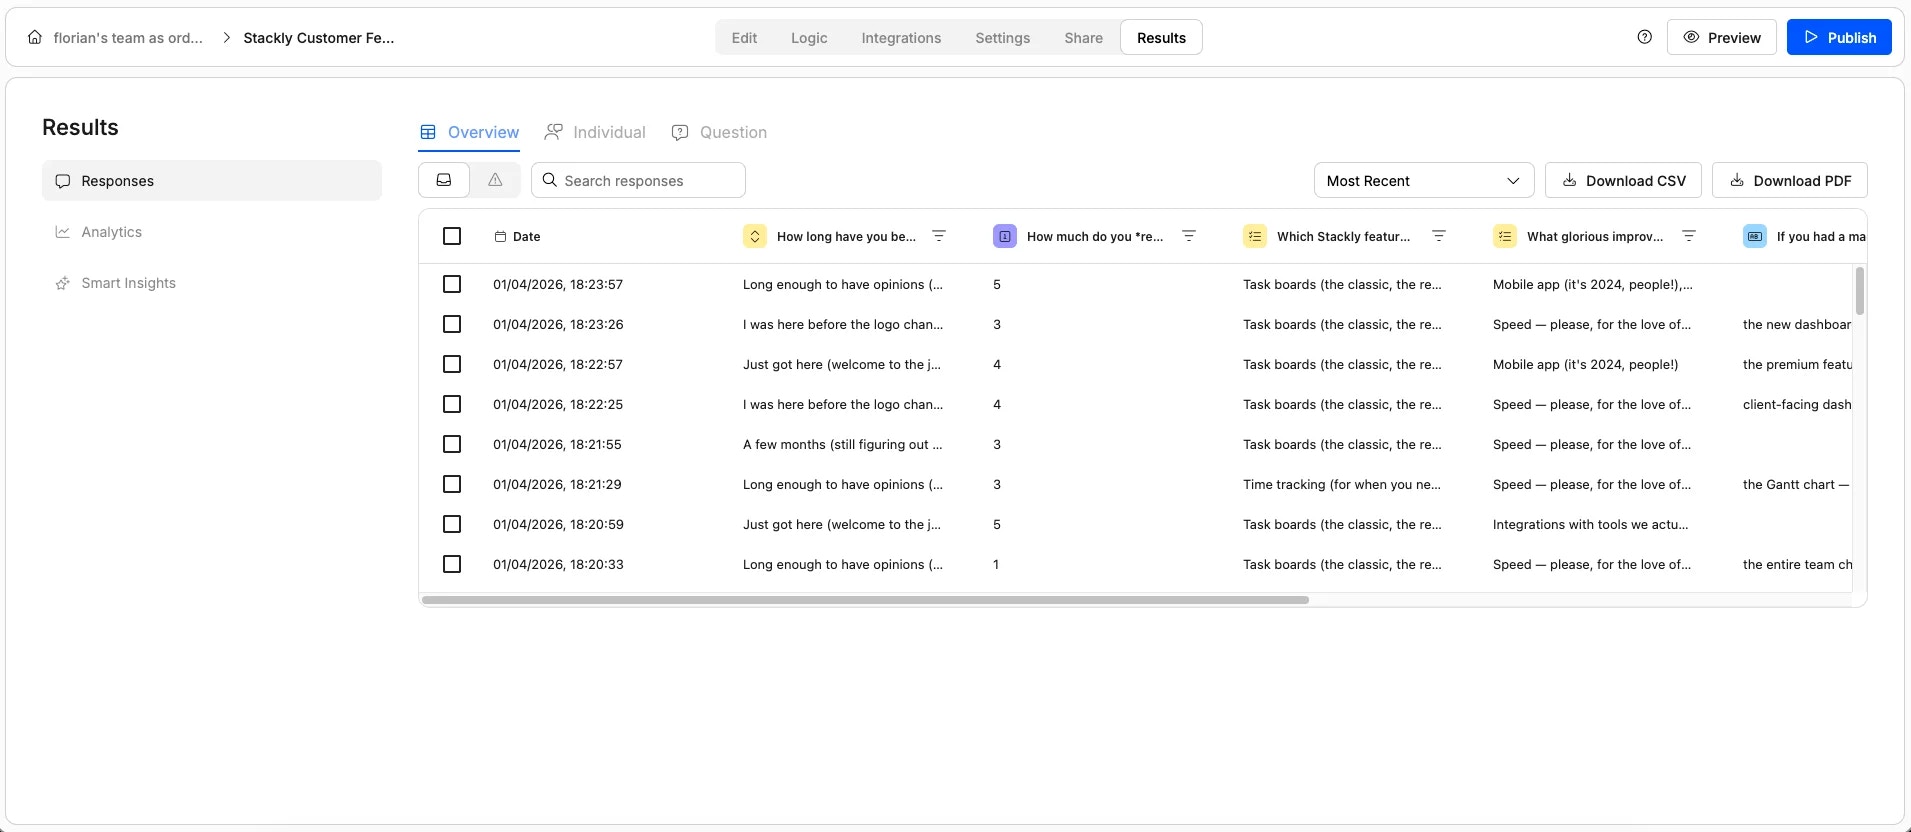
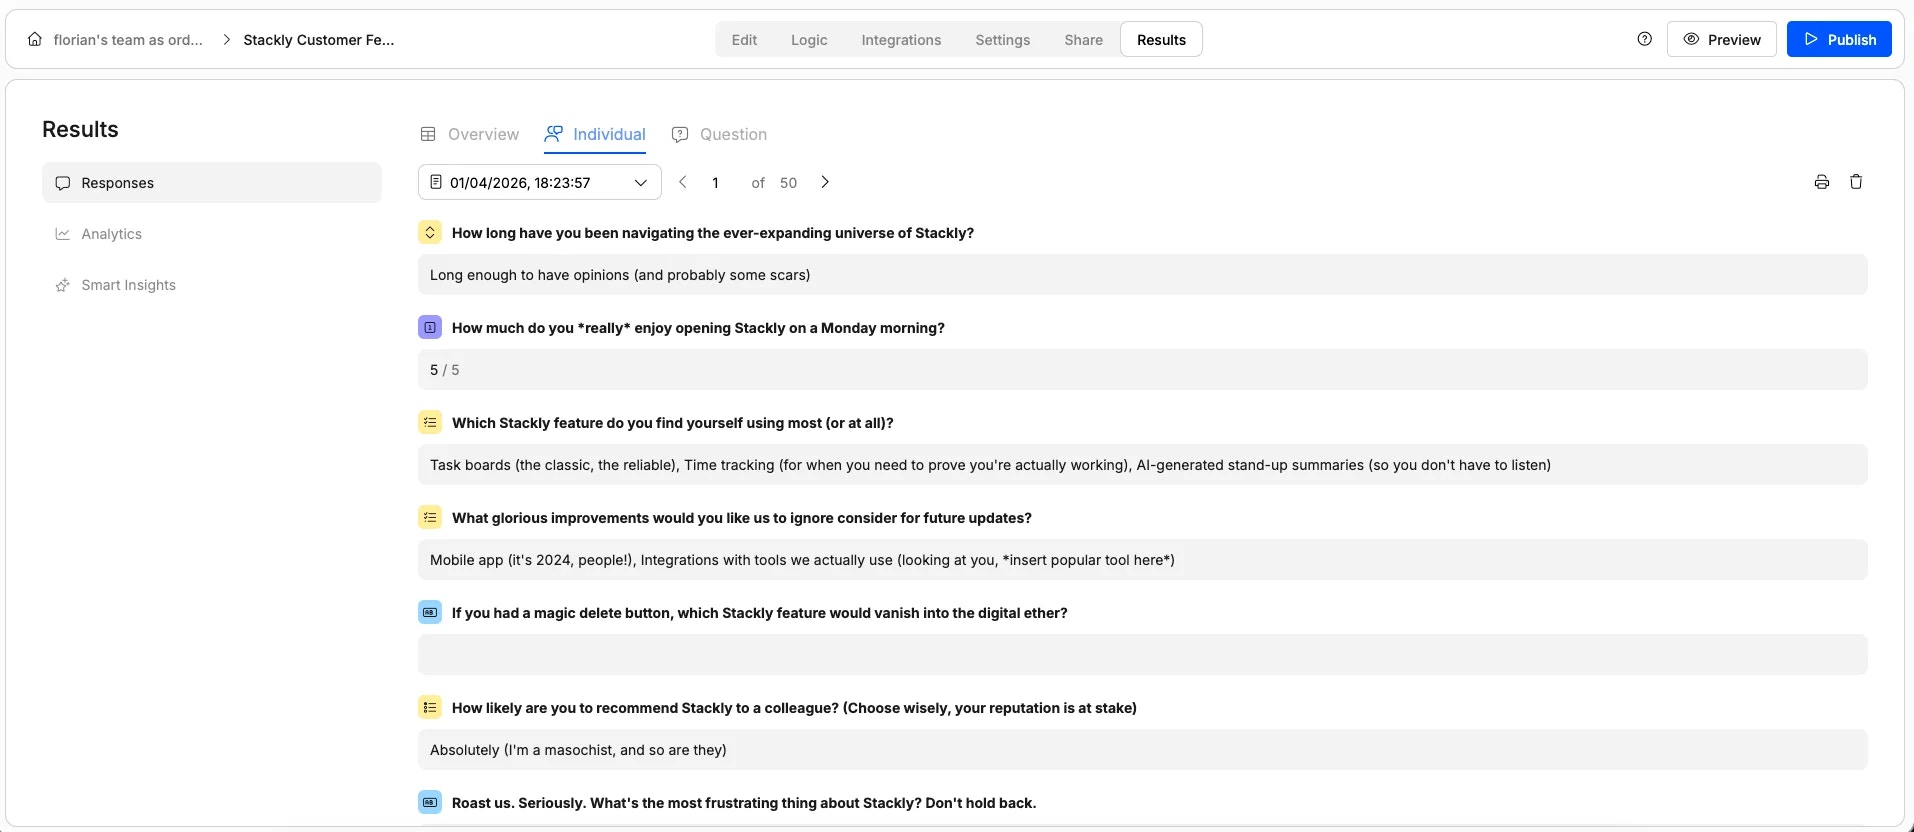
Once your form has collected responses, you have three tabs under the Results section:Responses
Analytics
A high-level dashboard showing how your form is performing over time: total views, number of submissions, and trends. Think of this as meta-data about your form rather than analysis of the answers themselves.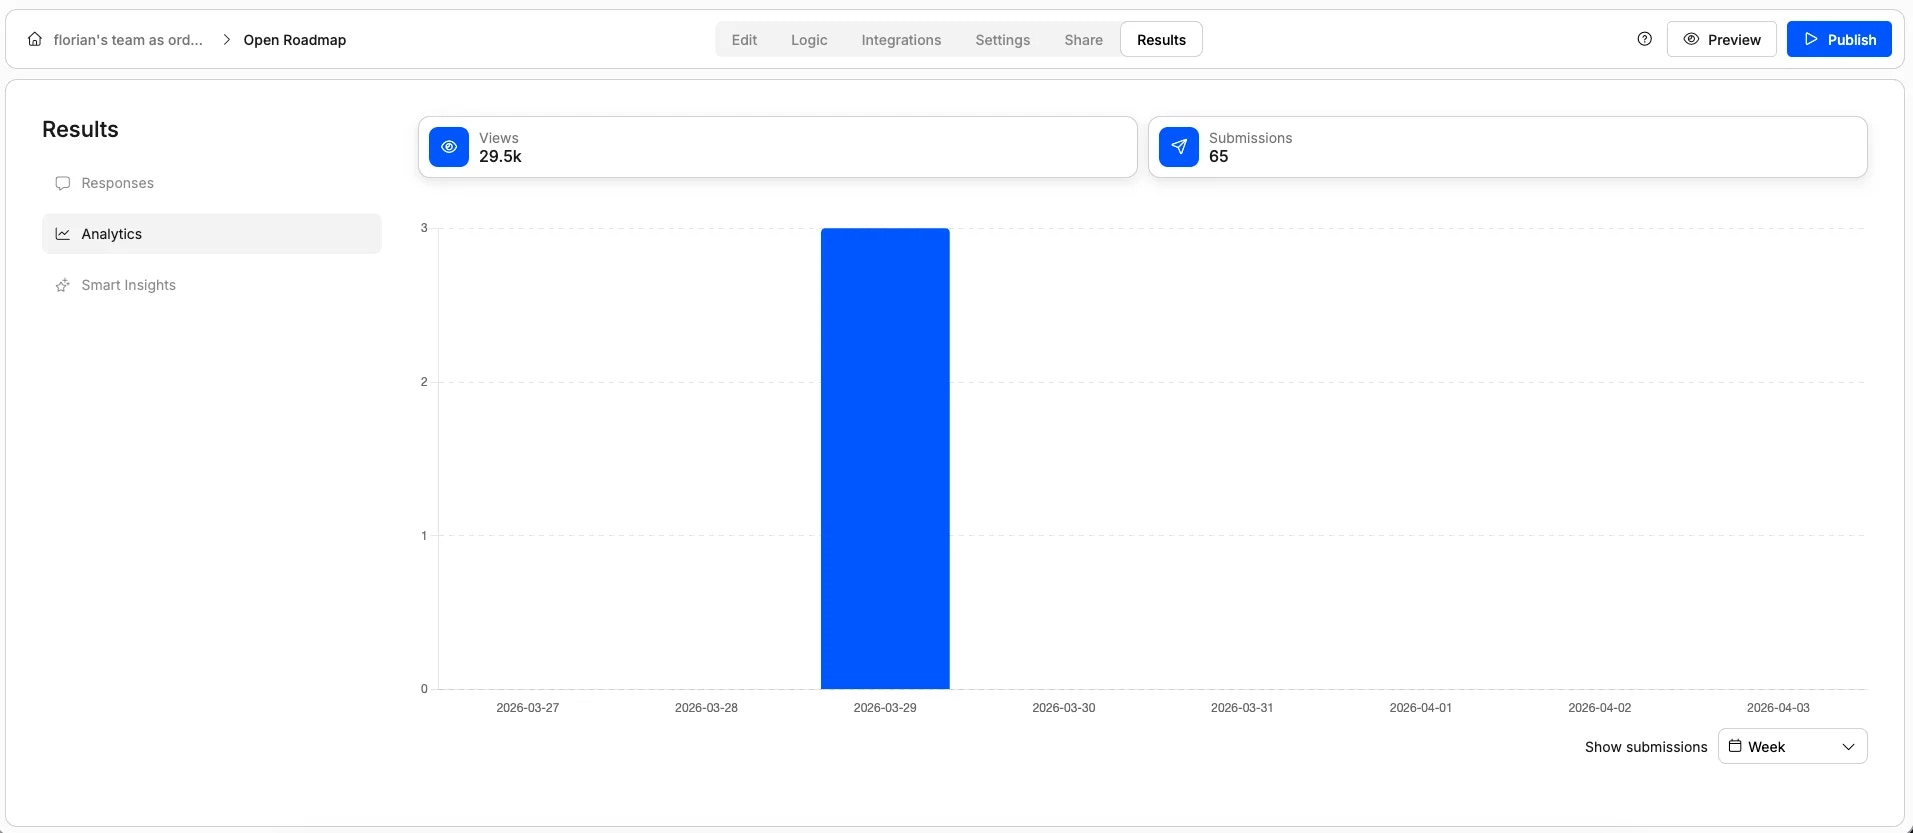
How Smart Insights analyzes your data
Smart Insights does two things that are hard to do manually: it clusters open-ended text responses into themes and it finds correlations across different questions.Clustering open-ended responses
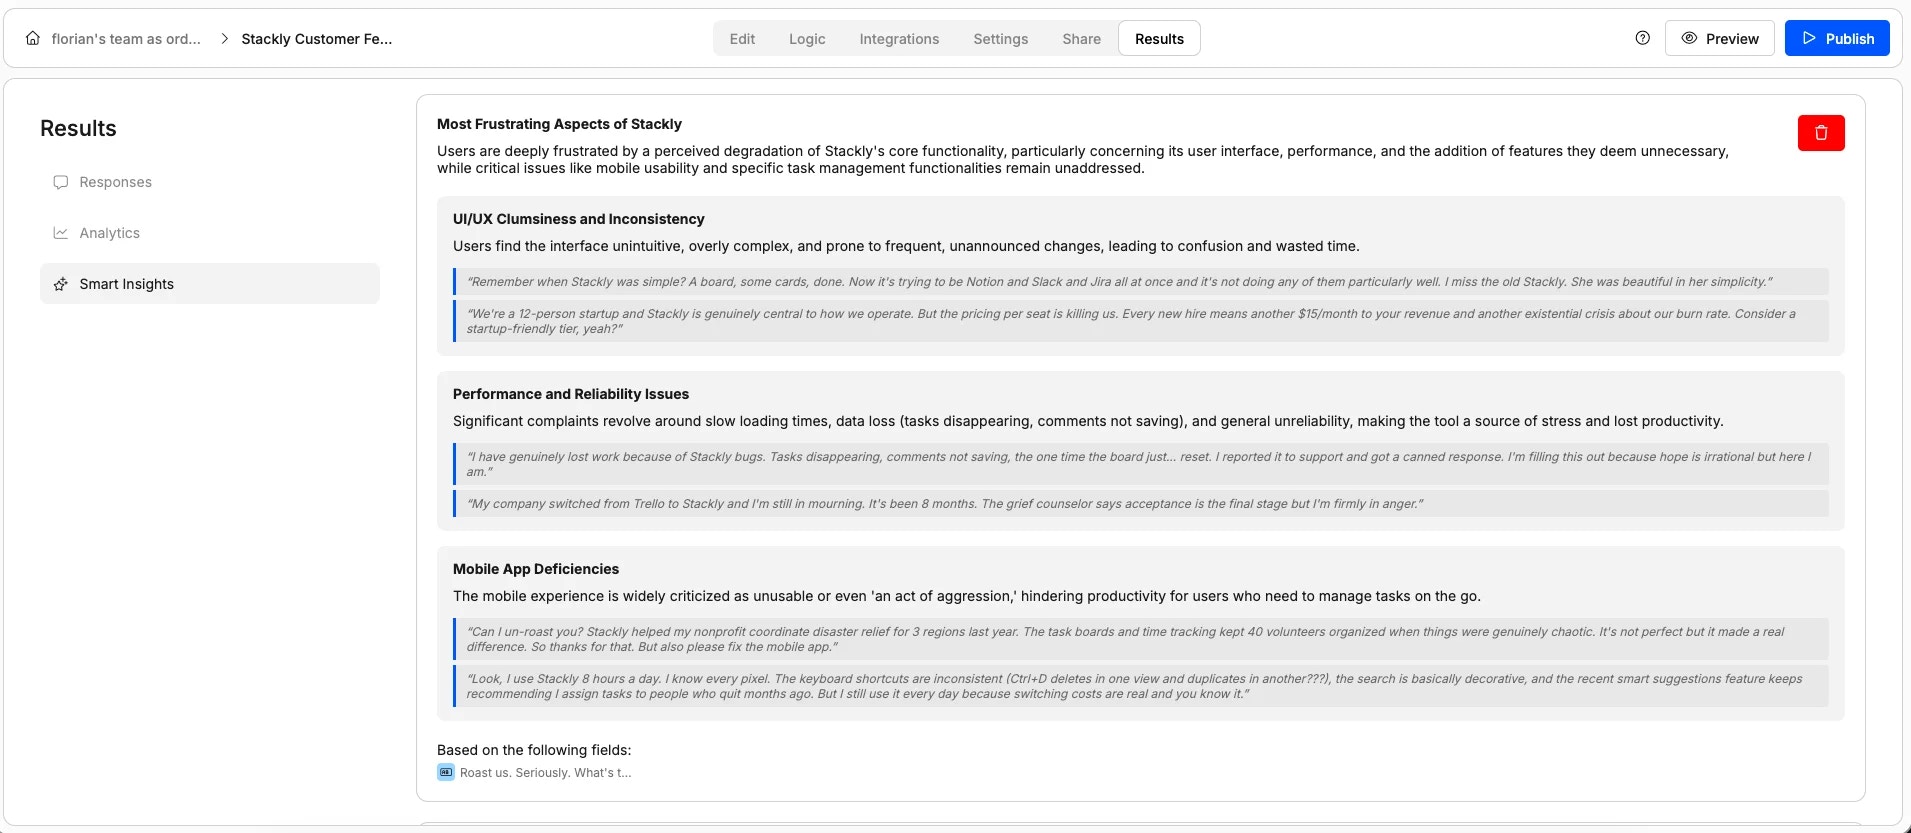
- Theme summaries — Each cluster gets a label (e.g., “Performance and reliability issues”) with a plain-language explanation of the category and concrete examples pulled from real responses. You see the pattern and the evidence behind it.
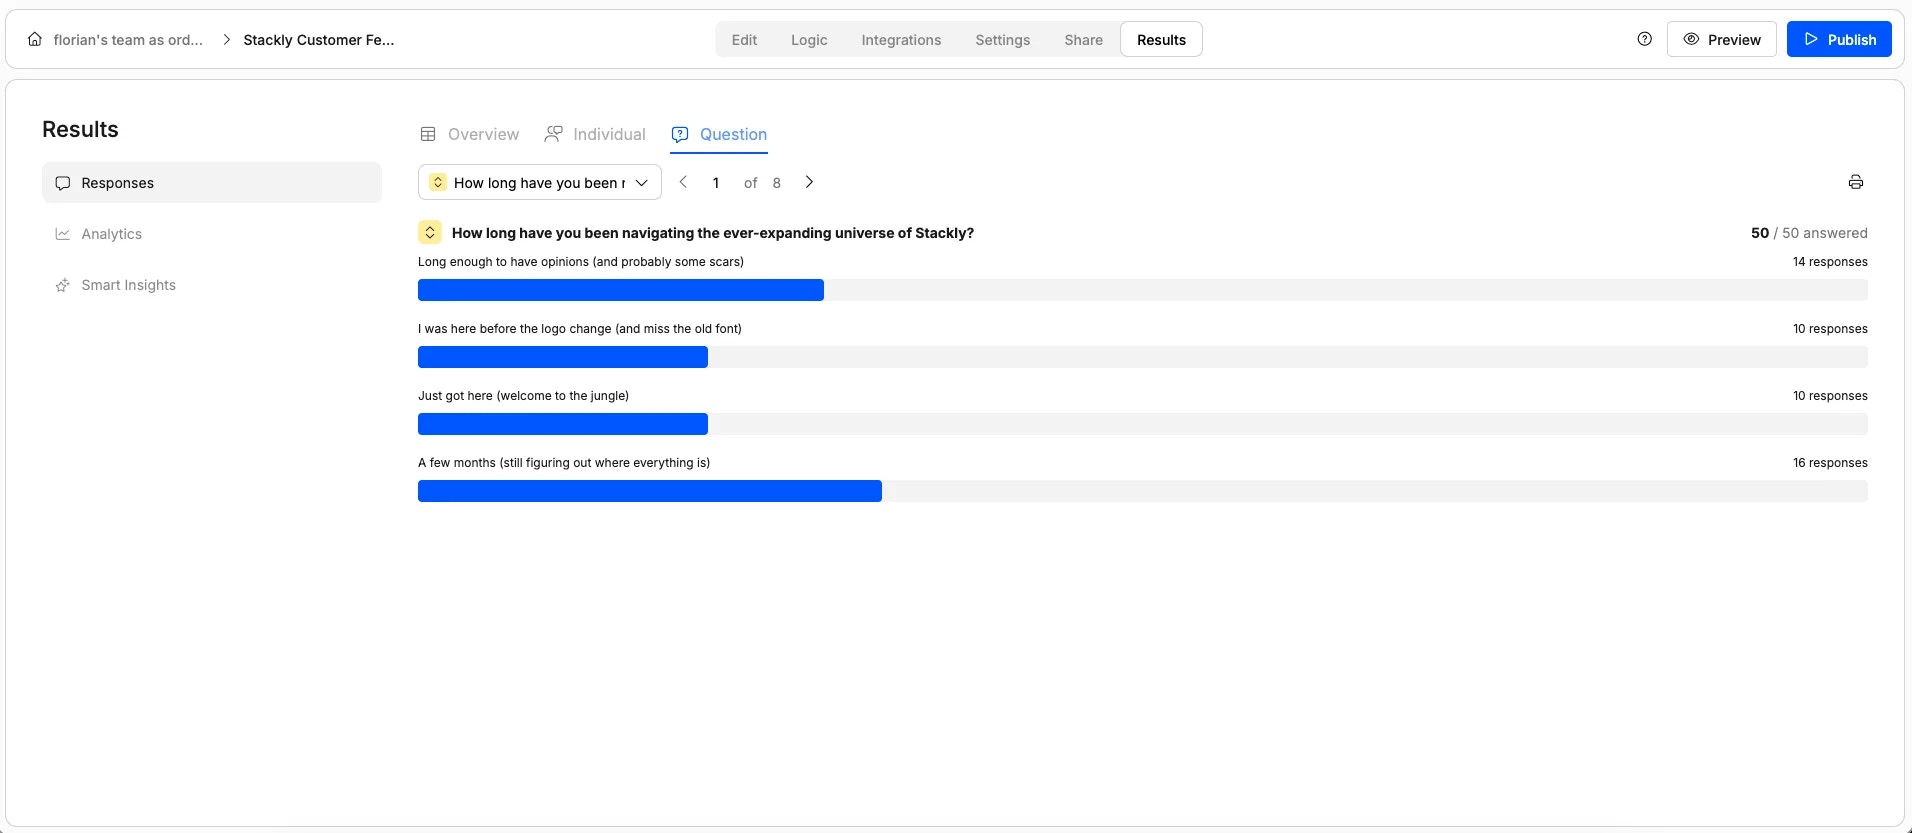
- Bar chart visualization — The same clustering data, shown as a chart so you can instantly see which themes come up most. For example, you might see that 4 out of 50 respondents would remove the “AI standup summaries” feature — even though they all phrased it differently.
Finding correlations between questions
Beyond analyzing individual questions, Smart Insights looks across your entire survey to find correlations between answers on different questions. For example, it might surface that users who requested improvements to the mobile app or integrations are also more likely to recommend your product. You’ll see a visualization showing the relationship: what one group answered on one question mapped against their answers on another. This kind of cross-question analysis is exactly the sort of thing that typically requires exporting your data into a spreadsheet and running manual comparisons. Smart Insights does it for you, automatically.When to use Smart Insights
Smart Insights is most valuable when your form includes:- Open-ended text questions where respondents write free-form answers that are hard to scan manually
- Multiple questions where correlations between answers might reveal something you wouldn’t catch by reading responses individually
- Enough responses to make patterns meaningful. The more submissions you have, the more useful the clustering and correlation analysis becomes